This is the eighth part of what will be a 10–part series of blog posts, which will ultimately be published in full as a single report. Two parts are published each week. This part is best read together with Part 7, where we started discussing offshore wind risks, focusing on the first two categories (general structured finance risks, and wind sector risks), with the part touching upon the last category (offshore wind–specific risks).
Earlier instalments:
Part 1 Part 2 Part 3 Part 4 Part 5 Part 6 Part 7
Offshore-specific risks
This brings us to the risks that are specific to offshore wind, being construction and operations.
Construction risk
As has been discussed in earlier sections, this is seen as the critical risk for the sector, with the lenders specifically asked to bear that risk and thus required to understand it and price it correctly.
Construction offshore requires the participation of very different contractors, starting with turbine suppliers and marine contractors, and including suppliers of foundations, cables and other equipment. This means a large number of physical and potential commercial interfaces which need to be managed, and that has led lenders to follow several strategies:
- The first one has been to try to limit the number of contracts as much as possible, and make such interfaces internal to the scope of broader contracts and thus the responsibility in the first place of the corresponding contractor. Items that can be bundled together can be the procurement and installation of part of the wind farm (such as foundations, or cables, or turbines); or the successive installation of various items (by having a single marine contractor in charge of all installation, for instance). The industry has been able to converge on a typical number of contracts ranging from 2 to 8, focusing on the 4 major “packages” (turbines, foundations, cables and substation), with their procurement and installation regrouped in various ways. Turbine supply is always a separate contract, given how critical it is to the performance of the project (and it is typically linked to a long term operation and maintenance contract), but everything else can be bundled into a “balance of plant” contract, usually with a marine contractor, covering procurement of all other equipment and installation of everything.
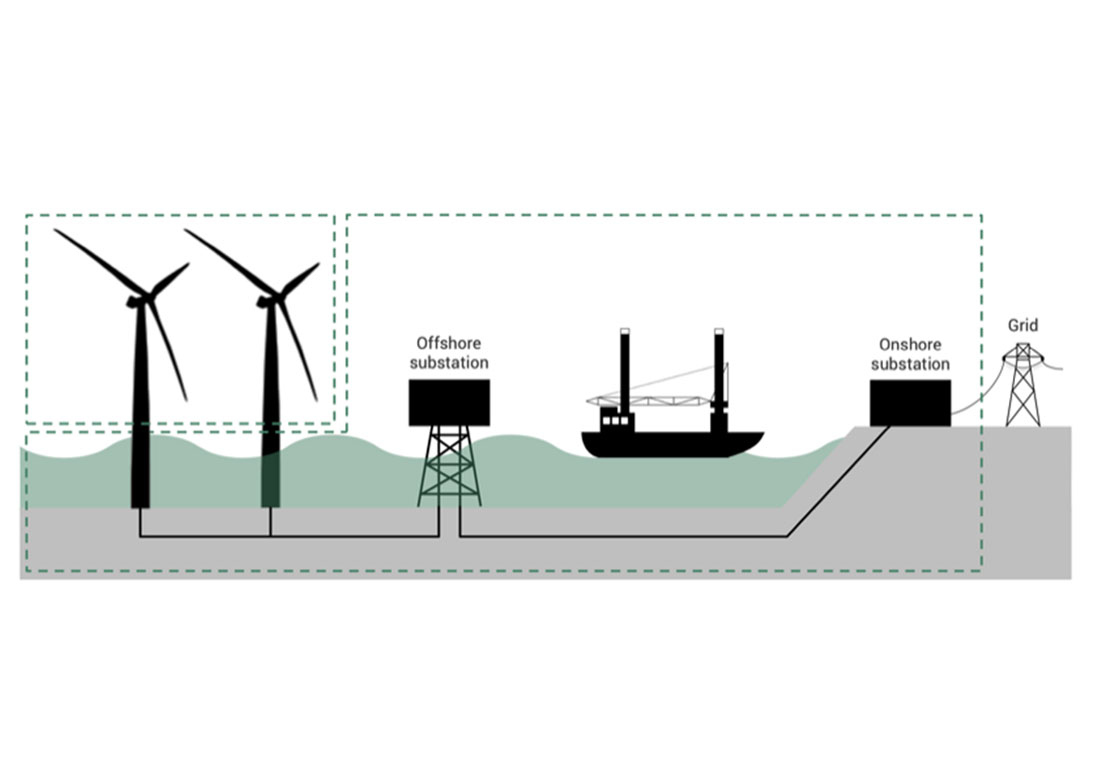
Figure 1 – two–contract structure
Source: Green Giraffe, “Recent trends in offshore wind finance”, April 2019, S8
In Germany, having four separate contracts for the design, procurement and installation of each of the packages has been a fairly traditional structure as well, with installation of some of these sometimes treated as separate contracts.
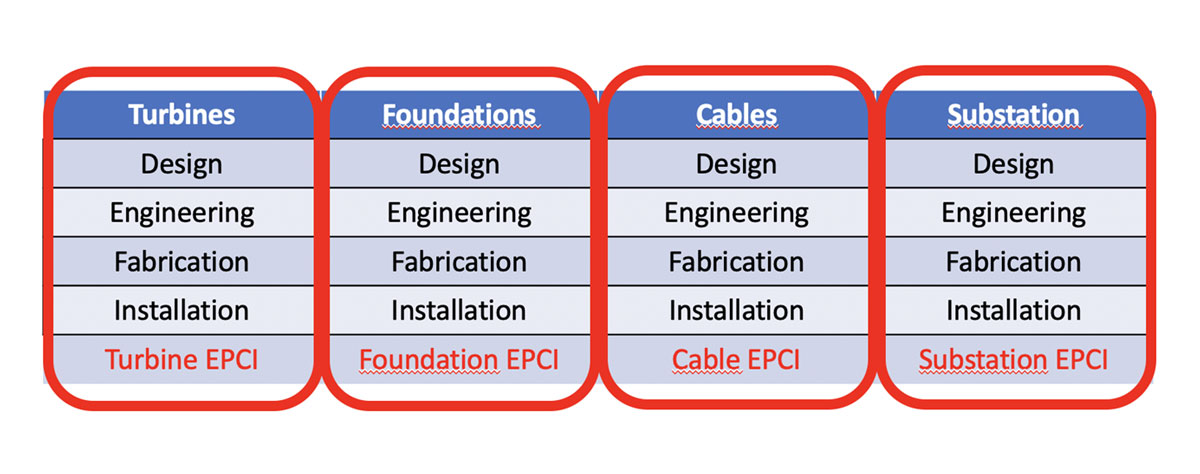
Figure 2 – four EPCI contract structure
The advantage of broad contracts is that the counterparty takes contractual responsibility to manage the technical interfaces (and contractual ones with their subcontractors) and make commitments to that respect, with (i) an obligation to perform the works to the standard agreed, with warranties in case of failure, and (ii) penalties in case of delays (including for quality problems). As penalties are typically expressed as a percentage of the value of the underlying contract, the absolute amount that can be triggered in case of problems is larger, in absolute terms, if the contract amount is larger (and this does make a difference in a set up where multiple contractors and sub–contractors are on the “critical path” – i.e. delay caused by any one of these triggers domino–effect delays on subsequent tasks – problems caused under a small contract will only trigger small penalties even if they slow down the whole construction)
- The second has been to focus on project management skills by enduring that the project team had enough experience to manage the contractors and ensure that they did their work without mishaps, and with as much coordination between them as possible. This means having experience managing the key contractors, understanding the project tasks inside out (even when they are within the scope of contractors), and understanding what backup plans can be used in any circumstance. People that have actually done it before have a real edge and the industry has wisely tended to allocate project leadership roles to people that had done it before – or were closely involved – on previous offshore wind projects. The core teams can be quite small – as noted in the example of Belwind previously, a team of 7 persons was deemed to sufficient given their experience and skills.
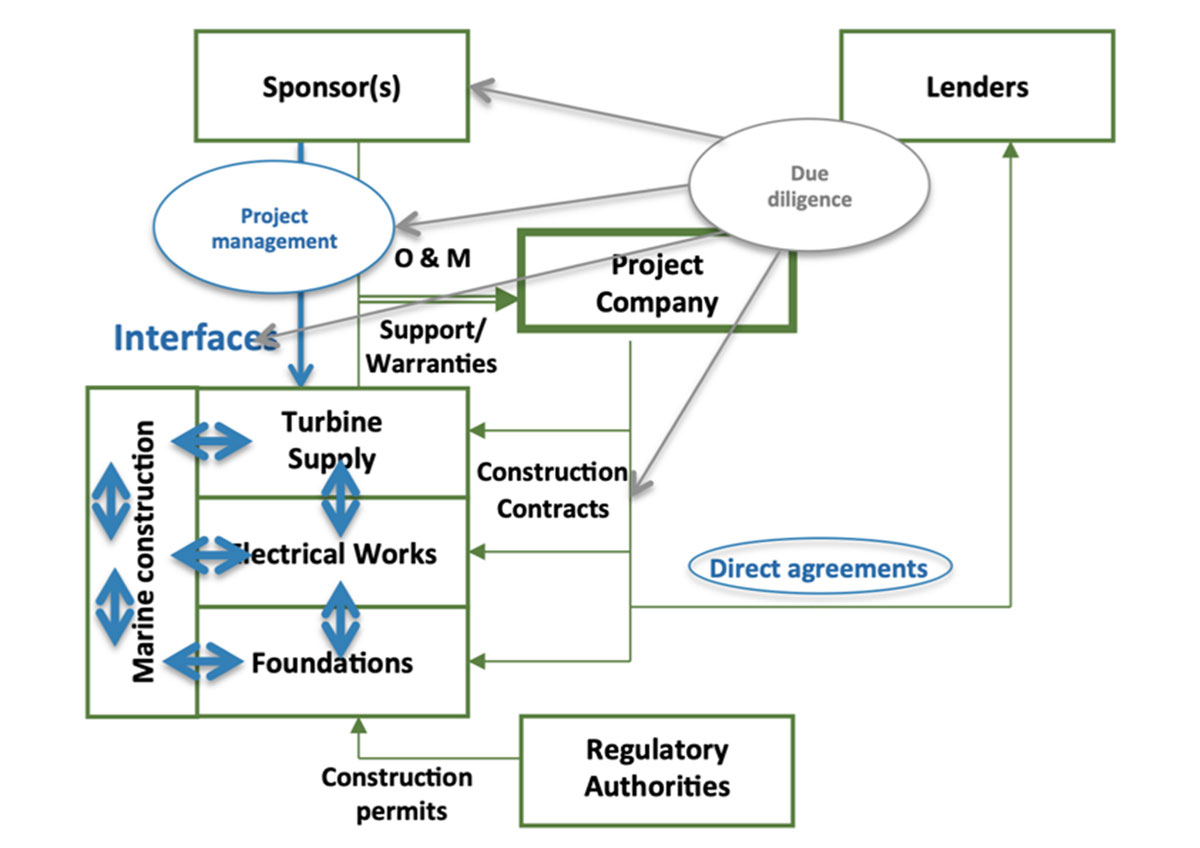
Figure 3 – Construction risk mitigants
Source: Green Giraffe, The different options to finance offshore wind, May 2012
- The third has been to push for maximum transparency across all items – contractors are expected to provide visibility about their subcontractors and how they manage the interfaces within their scope; contractors are kept informed of overall progress of work of the project and can adapt their own work more easily as a result (such as managing the exact timing of their work better); explicit handover procedures between contractors are negotiated and made transparent so that, even if two contractors do not have a direct commercial relationship, they can coordinate their work better, and so forth. This also applies to the “due diligence” phase, i.e. the review of contracts and plans by third party experts, who check that the proposed contracts are reasonable, from an engineering, legal or commercial point of view – that design is sound, that budgets and timing are realistic, and that warranties and palliatives are adequate.
- Further, the banks rely on the availability of additional funding (and time buffers) in the form of contingent funding. These are funds that the project owners do not expect to have to spend, but which are available in case of delays or other unexpected problems, in addition to the guarantees provided by the contractors, and do not require a new funding decision by either the owners or the lenders to be made available – they are part of the budget.
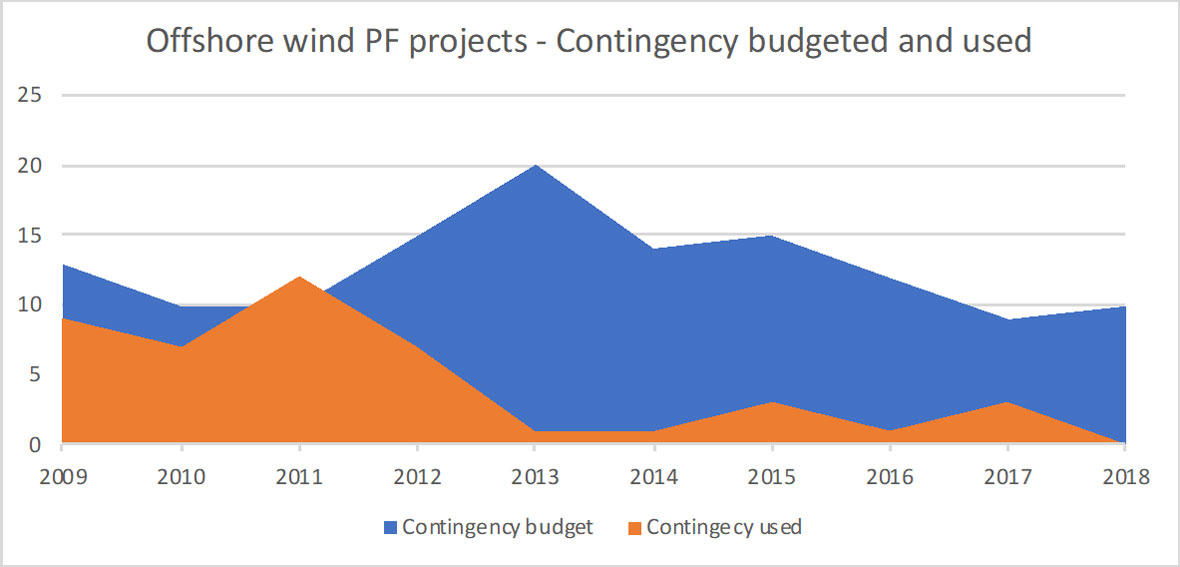
Figure 4 – contingency budgets, as allocated and spent (year indicates date of FC/FID)
Source: author calculations
The track record of projects that have been built with non recourse debt funding shows that, up to now, most projects have been built within the contingency budget allocated. The one exception happened when the first generation of German projects (all financed in 2010‑11) bumped against the same problem: the delay by TenneT, the grid operator, in building the offshore grid connections, as a result of technical difficulties with the HVDC (high voltage direct current) cables and sub‑stations. The direct current technology allows to transmit power over long distances with smaller losses, but it is more complex and less rarely used than alternative current (AC) cables, and the requirement to build several connections in the same year proved to be more difficult than expected. That meant that the projects which relied on such gird connections found themselves stranded and either had to delay the construction of the project, or the commissioning of the turbines already installed. The delays had a cost, which, together with the other ‘normal’ problems the projects faced, meant that they exhausted their available funding. The sponsors chose to provide additional funding to keep the projects on track – funds that they eventually recovered, as TenneT owed the projects compensation for the delays (following these delays, the law was changed to make the compensation amounts explicit and unambiguous).
The good news is that lenders and investors saw these problems as things that could be solved without destroying the long term economics of the projects, and lessons were learnt along the way as to how to deal with such situations. As the graph shows, this led to a temporary increase in the contingency budgets required for new projects, but these trended back to the 10% budget that seems to be the standard the market has converged to, even as actual funds needed have fallen to very low levels in recent years. Recent difficulties with projects in Taiwan (not visible yet on the graph above) suggest that new markets need to learn some of the same lessons in how to build projects and have to face higher contingency spending in the beginning.
- Finally, the lenders tend to require an insurance package (to cover accidents and “acts of God”) which is more extensive than investors (in particular utilities, which tend to self–insure) typically purchase. In particular, lenders will expect to see “contingent business interruption” coverage – i.e. insurance for lost revenue for events caused by third parties (like the cable connection not made available by the grid, or damaged for any reason). That has a cost, which is considered worthwhile as it allows to increase the volume of cheap dept funding.
Part of the risk of building at sea is the weather risk – i.e. the risk that wind, wave or other local site conditions do not allow for work to be performed. In principle, that risk can be assessed statistically, on the basis of past weather patterns, and can be mitigated by planning for central, best case and worst case weather scenarios. The industry uses “P10”, “P50” and “P90” numbers representing the scenarios that have a 10% chance of happening (aggressive planning), resp. 50% (central scenario) and 90% (conservative scenario). The P90 scenario requires more time for construction as vessels and equipment have to wait longer for the relevant weather windows when work can be done, and this is typically the reference scenario for the lenders, which are more conservative and want a high probability that the budget will be met. Given that vessels are usually contracted out on the basis of daily rates, there is an additional cost in booking the option to use them for the longer period, which may not be necessary.
As this is quite predictable statistical risk, there are various ways to carry that risk – the project can keep it (planning for a p50 or even p10 scenario but agreeing to pay the difference if it takes longer), it can be passed on to contractors (by paying for a fixed price which is above the P50 cost but below the P90 cost – the contractor can then decide on how to optimise installation, or take insurance for the weather risk), or it can be insured. Lenders care that the budget for the worst scenarios is available in any case, but do not mind if some of it is included in the contingent budget (usually, as a well identified amount) rather than the base budget.
Altogether this means that lenders impose quite a lot of scrutiny and constraints on the construction contracts, and require a lot of scenario planning to test, sometimes to extremes, all possible outcomes. Monte–Carlo simulations (where thousands of scenarios are tested to see the full range of outcomes and assess their probabilities) are typically required to be run with the help of independent technical advisors. A lot of these scenarios are extreme and unrealistic, but the mere fact of asking “what if this or that happened?” sometimes help ensure that simple backup solution are available, just in case – and these can end up helping in other, unexpected, circumstances. Identified risks are rated according to (i) probability of happening, and (ii) impact in case it happens and risk mitigation naturally focuses on ensuring that those with a “high” or “medium” rating for both items can be fully avoided or absorbed. Low probability, high impact risks should be insured, and high probability, low impact items needs to be incorporated and managed as part of the construction process.
While effective, this level of intrusion is not acceptable to all investors, and in practice, offshore wind developers need to decide early on if they will internalize construction risk (in which case they can manage contracts and project management on their own and avoid external scrutiny) or if they want third party debt, in which case they need to accept some level of “backseat driving” in how they run the project. This has led to two quite different routes to managing constructions of offshore wind projects, each with its pitfalls and advantages. While the market is “lumpy”, both routes typically represent half of the projects to be built, on average, as shown in the graph in Part 2 of this series.
As shown above, the track record of project–financed wind farms, for which there is more available data, is quite excellent overall, in line with the EY study mentioned in Part 1.
Operation risk
Operation risk is the risk that the project ends up producing less electricity than expected, or requires more (and more expensive) maintenance to perform.
This is not about the wind risk (discussed previously), nor the technology risk per se, but the wider combination of performance at sea, ability for the O&M teams to intervene when required, and any unexpected losses or costs to be incurred by the project.
The harsh reality is that most projects and turbine models have to face “teething problems” – technical issues that appear in the early days of operation and require some level of intervention. It can be faulty equipment, sub‑components that were not correctly installed and break down and need to be replaced, or serial defects (identical problems appearing on multiple turbines) of varying magnitude that require a more extensive campaign of intervention.
The industry has a good record of dealing with these issues. They have not been costless, but they have all been solved with responsibility and funding shared between the project owners, contractors and insurance companies, when possible. Most turbines and most projects perform at very high levels of technical availability within 2 years of installation and often much earlier. The serial nature of the power plants, and the fact the installation of wind turbines is largely done sequentially allows to learn lessons from the early turbines and anticipate problems in subsequent turbines (for instance doing any replacement of identified faulty parts onshore, before the turbines are actually installed).
Some projects had severe serial defects on major components like the main axis or the gear box (which require a large installation ship to replace the part) and, in the worst case known to the industry, the lowest availability measured over a 12‑month period was 50‑55%, and that is the standard of under‑performance that lenders want projects to be able to withstand for at least one year while still managing to service their debt. This is done by a combination of the natural buffer used in debt sizing (more revenues are expected than just the funds required to service debt), warranty payments by the turbine manufacture (they typically guarantee an availability level of 90‑95% with a contractual commitment to pay for the lost revenue if turbine performance is below that level without an excusable reason) and reserve accounts.
Lenders have shown strong trust in the industry even when severe problems appeared, and the problems have indeed been solved without any project going into insolvency or administration. More positively, a recent project in Germany was financed by lenders even though the turbine selected by the project was experiencing a major serial defect on a key component on existing projects (which the banks had financed and thus were aware of). The turbine manufacturer was able to convince both its clients and the lenders that it had a plan, involving a partial redesign of the turbine for the new project, a fix for the turbines not yet installed on existing projects under construction, as well as a replacement campaign for the turbines already at sea on operating projects, with a budget and a timetable. This was deemed solid enough to allow the new project to go ahead with that upgraded turbine.
A good part of the solution always involve the turbine manufacturer and long term commitments from them backed by financial warranties. It is telling that on the early projects, the manufacturers were wary of offering such long term “all‑inclusive” contracts, as they themselves were not completely sure of the long term performance of their machines at sea, since there was so little track record beyond a few years. After agreeing to do so for the first projects to be financed (under strong pressure from the lenders, who said they would not finance the projects, and thus the turbine supply contracts), they realized that such long term contracts, typically with pre–agreed prices, were actually quite advantageous to them, as (i) the performance of the turbines was even better than they warranted, and (ii) the cost for them of maintaining them was lower than the price the projects agreed to pay, and was actually on a downward trend, making these long term contracts quite attractive. So they began to offer them quite spontaneously to projects, which made them easier to finance. Naturally, investors started negotiating the price of these contracts more carefully as well, and occasionally pushing back the banks’ requirement for such long term contracts.
Altogether, the performance of European offshore wind farms has been consistently strong, with availability numbers above 95% for most turbine models, and no surprises on the O&M cost side. Most of the incidents that have taken place in offshore wind tend to have been insurable events (for instance a cable damaged by the anchor of a vessel) with limited direct cost repercussions for project investors or lenders. The insurance market has had to bear a number of events but so far insurers have continued to accept to provide relatively standard coverage to projects on competitive terms.
Overall, as the EY report flagged upfront, and as was noted by investors and lenders, offshore wind has been quite a successful story on both the construction and operation fronts, and this has made it a very attractive asset class, leading to increasing competition amongst financial players and thus more attractive term for both debt and equity.
This is what has led to lower financing costs, as well as lower contingency budgets, both at the project level and within contractors’ scopes, bringing about reduced budgets.
In the next chapter we look at the evolution of these financing terms and where they stand now.