This is the ninth part of what will be a 10–part series of blog posts, which will ultimately be published in full as a single report. The last part will be published later this week.
Current financing conditions
In this chapter we discuss the main terms prevailing for the two core financing strategies, using respectively the balance sheet route and the project finance route
Balance sheet construction
Utility investors
Under this strategy investors (usually the leading utilities in the sector) keep the construction risk on their books but finance, or refinance the project by bringing in passive third party investors who take the long term operation risk. Such third party financing can take place before construction is actually completed, with the support of construction guarantees provided by the leading investor, and can include non recourse debt funding for that third party (what is called “holdco financing”, as described below).
The core principles of this strategy are for the utility leading the project to keep full control over construction, with minimal interference from outsiders like lenders, and consolidate the project revenues (and generation capacity) on their books, while gaining access to cheaper long term capital to improve the overall economics of the project.
The utilities take the final investment decision (FID) on their own, without depending on external funding, but they will typically anticipate the terms of such funding in their business planning. The sale of a stake in the project will typically take place either after completion or after FID (in that case, including completion guarantees). Such stake is typically 50% minus one share, so that the utility can keep control and consolidate.
Insert – utilities selling minority stakes
DONG (now Ørsted) pioneered the sale of non–controlling stakes (typically 49%, or 50% minus one share) in their offshore wind projects, and have made it a systematic strategy. By keeping a controlling stake, they can consolidate the projects in their accounts, and be credited the full generation capacity while recycling some of the capital invested in the projects. By selling operating projects (or, if not yet built, selling them with a completion guarantee), they can attract cheaper capital and obtain a better price for the asset than it cost them to build it. For instance, in 2016, they sold 50% of the 258 MW Burbo Bank expansion project, a project benefitting from a government–set power price (via a CFD) at a level of 150 GBP/MWh, to LEGO and PKA for a price of GBP 660 M. That represents a value of 5.1 MGBP/MW, when construction costs at the time were typically in the 3 MGBP/MW (ie they would have built the full project for something around GBP 800 M), thus creating a substantial profit. The high purchase price was driven by the nature of the asset, generating highly predictable revenues (without volume or price risk, and limited operational risk) for a long time, which made it very attractive to pension funds and similar long term investors.
A few months afterwards, DONG bid a price of 72.7 EUR/MWh for the Borssele project in the Netherlands. One of the key reasons it was able to bid such a then–record–low price was by giving up the windfall profits made possible by the sale of projects with high tariffs set by governments, and identifying the tariff that still would allow to build the project, and sell half of it to a risk–adverse investor at a “normal” price (i.e. the investors would still pay a good price for very low risk long term revenues, but as the absolute level of revenue generated would be lower, the net price per MW would be correspondingly lower). Ørsted sold half of Borssele 1‑2 in 2020 to Norges at a price of 3.6 MEUR/MW. (Note that price is higher than it would have been in 2016 for the same asset, as risk perception went down in the meantime, and the equity return requirements of investors similarly went down, allowing them to bid more for the same kind of cashflows. If the project had benefitted from a tariff similar to Burbo, it would certainly have sold for more than double the price). The sale is still useful for Ørsted, as the cost of capital of the new investors is lower than its own, and thus they value the project’s cashflows more than Ørsted, but the difference between the price at what it could have sold the project if it had had a high tariff, and the price they actually received was converted into a lower tariff. Ørsted was able to reduce the tariff level at which the project was still profitable for them, taking into account the low cost of capital for half the project, the requisite return on capital for their own half the project, ancillary revenues linked to their role as operator of the asset, and the actual construction costs. As the numbers show, the mere fact of having an auction for the tariff instead of a preset price led to the disappearance of such windfall profits.
Holdco financings
The buyers will typically be financial investors who either invest the full amount directly or use a combination of equity and debt raised at the investment vehicle level and not at the project level.
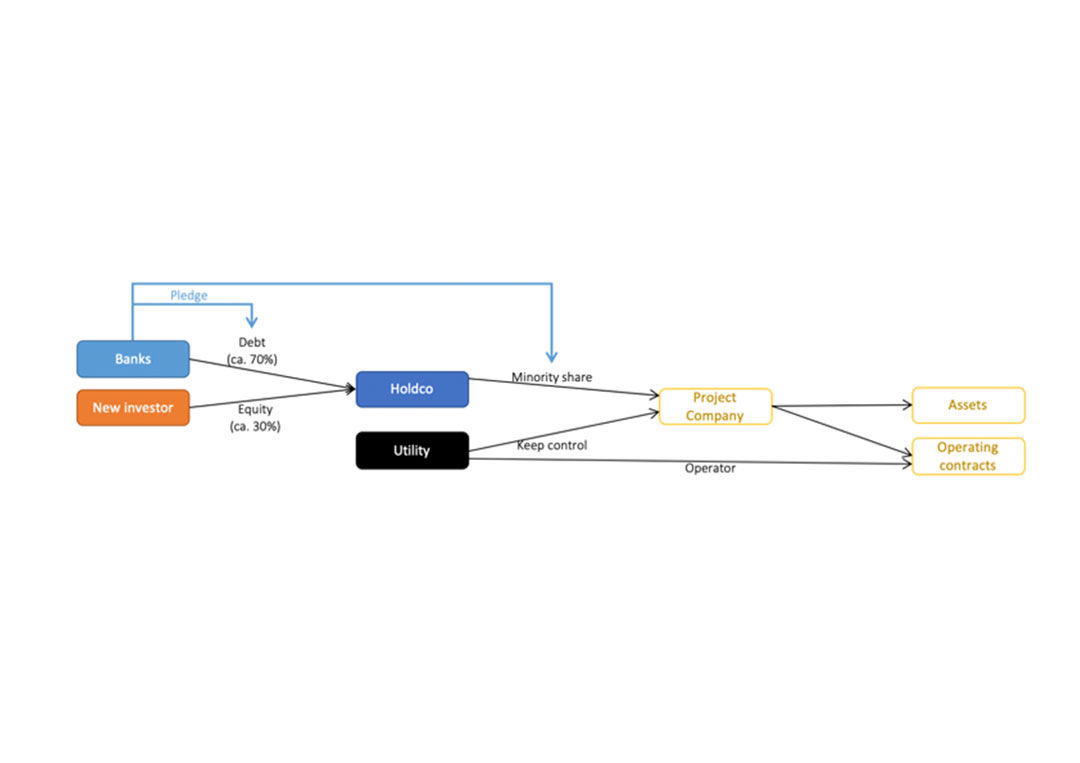
Figure xx – Holdco non recourse financing structure
Under holdco financings, lenders do not have direct access to project revenues and contracts, so they cannot take the kind of security that they usually enjoy when lending directly to the project, such as rights or mortgages over project contracts and assets. Nevertheless, given the fact that the project company is almost always an entity that only owns and operates the one asset, being the wind farm, and distributes its incomes to the maximum extent to its shareholders, lenders generally accept that they bear a fairly similar economic risk as if they were lending directly.
They have security on the shares of the new owner in the project and typically ask for a “direct agreement” with the operator utility, i.e. a contractual relationship whereby that utility provides a certain number of commitments as to its behavior as an owner and as the operator of the project that give comfort that the project will be run in sensible and fair way (for instance, if the utility provides operation and maintenance services to the project, which is usually the case, that contract and any subsequent modifications would be subject to the agreement of the lenders to ensure that it is done on an “arms’ length basis” i.e. that the utility provides a competitive price for its services and does not use that contract to siphon a larger fraction of the income of the project than warranted.
So in practice, in the absence of construction risk and in the context of projects operated by strong experienced parties, the terms for such holdco debt facilities have been very similar to those provided as direct refinancing of operating assets, as presented below.
The advantage of a holdco structure for the operating utility is that they can still consolidate the generation capacity and assets of the project without having to consolidate the debt. It also allows them to tap a larger universe of buyers, and potentially find a better price (if the average cost of capital of the buyer, taking into account the debt component, is lower than that of a buyer that does not use non–recourse debt).
Equity returns
Investing in an already built offshore wind farm with a long term tariff and a major utility as the key shareholder and operator is the least risky option in the sector, and risk–adverse financial investors have typically looked at such assets to enter the sector and have compared the returns they offer to whatever else they could invest in – so the IRR requirement for such an investment (without debt) is the benchmark for the sector (to which more riskier opportunities within the sector like bearing construction risk, or including leverage, are compared) and it is also a number which provides an external benchmarking of the risk and attractiveness of the sector compared to other investment opportunities (whether similar like infrastructure assets, or any other like equities, bonds, commodities, etc.)
As noted earlier in section 4.7 (part 6), this benchmark IRR has gently gone done over time, and today it is considered that it is in the 5‑6% range for unlevered investment (ie without debt). From that number the returns expected for riskier assets in the sector, whose additional premium has also shrunk gently over time, can be seen in the table below.
| Investment | Expected return |
| Operating wind farm with an experienced operator | 5% unlevered |
| Operating wind farm with an experienced operator, holdco levered structure | 7% levered |
| Construction risk (construction period only) | 8–9% levered |
| Late development (permitted projects) | 12–15% (no debt yet) |
| Early development | 20–25% (no debt yet) |
Figure – return expectation for offshore projects at various stages
The numbers above are naturally quite meaningless without understanding what the key underlying assumptions are, and what “standard” set of assumptions is used. Some categories of investors seek lower or higher return than those mentioned above, but will correspondingly use more conservative (respectively more aggressive) assumptions to calculate future cashflows. Amongst assumptions that can influence things, one can note the duration of the asset, operational performance (availability levels, technical losses), wind resource used (P50, P75, P90), debt terms, long term power prices, evolution of operating costs and insurance costs, etc. It is important to harmonize those to compare return expectations properly.
Debt refinancings
Projects that are built on balance sheet can be refinanced with debt. As noted above, this is often done only for the part of the project owned by new investors via a holdco financing, but it can also be done at project level. At that point, lenders are much less stringent in terms of requirements on the contracts and due diligence, so typically the main issue is one of consolidation – industrial investors that consolidate the projects would need to consolidate the debt as well, and they typically try to avoid that. But some projects are owned by consortia where no party has an outright majority or control, and in that case consolidation issues are much less relevant.
The terms for such debt financings are essentially similar to those for project re‑financings after an original non‑recourse financing and thus are discussed in the next section.
Project finance construction
Under this strategy, debt is provided prior to construction and banks take construction risk fully – project owners are not obliged to contribute any additional funding beyond the agreed equity commitments and do anything beyond the contractual commitments they take in respect of propjet management, operations or, if relevant, power purchase agreements.
This is the “full risk” approach for the banks (and investors, who take construction risk and bear the volatility of returns that rely on dividends that can only be paid after debt service has taken place). Accordingly, the terms for the earlier transactions were quite conservative, as regards debt sizing methodology, securities and other mitigating factors, and have improved over time as lenders have become more comfortable with the industry and its risks.
Debt sizing metrics
Lenders typically use two criteria to define the amount of debt they are willing to provide to a project:
- A metric linked to the cost of the project, reflecting the fraction of the investment they are willing to provide. This is called “leverage” and measured by the “debt:equity ratio”, typically expressed as a fraction: “70:30”. The logic here is that lenders want some commitment (or “skin in the game”) from investors to ensure that they will make all the necessary efforts to ensure the project gets built and operated properly;
- A metric link to expected revenues, and more specifically to operating revenues (gross revenues minus expenses that are absolutely required for the project to keep on functioning, such as operation & maintenance costs, taxes, etc.). Such revenues are what is available to repay the debt (they are often also explicitly called “cash flow available for debt service”) and lenders want such revenues to be sufficient in every period to repay the corresponding debt service (interest first, then principal)
Cash Waterfall
• Operational expenses and taxes
• Interest on debt
• Principal
• Repayment of shareholder loans
• Dividends
Obviously, the numbers used for revenues and operating costs depend on a number of assumptions, and these can be more or less favorable to the project or not:
- Revenues are based on wind levels, derived from probabilistic wind studies – different probability levels can be used – sponsors usually refer to the central “P50” case, while lenders will typically used the lower “P90” level (the level that has a 90% chance of happening– and even that offers further opportunity to be more conservative, as one can use the “P90‑1‑year” (the probability that any given year wind levels are above that number) or the “P90‑10‑year” (the probability that the 10–year average wind levels are above that number). The production level under the first standard is naturally lower than the second.);
- Revenues also depend on the assumed availability of the wind turbines (which can be linked to the number guaranteed by the turbine manufacturer, but can also be lower, or higher), and associated assumptions for various losses (for things like voltage conversion, transmission within the wind farm, transmission to shore, etc.)
- Costs are linked to what is budgeted for operations & maintenance, of the planned kind and the unplanned kind (reaction to incidents). Depending on the scope of the operating contracts, which can be all‑inclusive or less inclusive, these numbers will be highly predictable (if the operator offers a fixed–price full scope contract including all unplanned maintenance, including replacement of major components, if needed) or dependent on assumptions about the frequency of interventions, their nature (whether they require heavy lift equipment to replace components) and their expected cost. If the budget is not fully contracted, banks will typically expect to see buffers to cater for unexpected interventions;
- Another important cost item is the insurance budget, which can represent 20–30% of the operating costs depending on the nature of the coverage, the maximum amounts insured and the deductibles. Lenders typically require a fairly extensive insurance coverage. Insurance can usually be taken only on a yearly basis, with renewals that can be subject to price modifications based on the costs borne by insurers in previous years (i.e. if they have to pay for unusually expensive incidents in a given year, they will usually try to increase yearly premiums in subsequent years).
Once all assumptions are agreed, the lenders and the project agree on a coverage ratio, which is the ratio of available cash for a given period to the amount that lenders are willing to consider as debt repayment for that period. For a typical house mortgage, banks ask that debt service be limited to a third of the income of the borrower: that’s a coverage ratio of 3 – but in this case calculated over gross revenues rather than available revenues after unavoidable expenses). For offshore wind farms, the coverage ratio was initially set, for early projects, at 1.35, using long term P90 wind assumptions, and has trended down slowly over time, as shown in the table below.
Pricing and other commercial terms
Naturally, the pricing of the debt (called the “margin”) is an important commercial factor. Interest for corporate (and project finance) debt is calculated as the sum of two components – an underlying index, like EURIBOR, which reflects the cost for banks to borrow money themselves on the interbank market, plus the margin itself. The margin is the remuneration of the bank.
The index is variable over time and borrowers like offshore wind projects, which have largely fixed revenues, and do not want to bear interest rate uncertainty, typically choose to “hedge” that variable interest rate by “swapping” it for a fixed long term number. The market for interest rates of all maturities is one of the most liquid financial markets and it is possible to swap variable interest rates even over the very long term. This is typically done on financial close – that calculation also drives the final amount of debt given that the exact amount of interest to be paid (from the amount of cash flow available from debt service, divided by the cover ratio) will only be determined then. Given that swap markets are quite liquid, it is at least possible to have a good idea of where the interest rate will be in advance but they do vary from day to day.
The total cost of debt for the project is derived from the fixed rate of the swap plus the margin. The swap is an element that neither the project nor the lenders control, but the margin is something they negotiate. Another important pricing item is the upfront fee (a commission paid to the lenders to agree to lend money and spend the time required to assess the project and get the loan approved internally).
Naturally, the duration (“maturity”) of debt is also an important element – the longer the debt, the easier it is to spread repayment of principal over a larger revenue stream, and increase the overall debt amount.
Finally, given the size of the projects and the risk involved, banks rarely want to lend on their own and prefer to be part of a group of lenders (a “syndicate”) that all lend smaller amounts, all on the same terms (and who share all risk and income equally). In order to simplify the negotiations, projects try to negotiate with a smaller number of banks, called “underwriters”, who commit to lend bigger amount and then share the risk with other banks on the terms they have agreed (this is called “syndicating” a transaction). The amounts that banks are willing to underwrite are an important commercial element as it drives the number of banks that are required to reach the requisite amount of debt.
The debt syndication markets in project finance stopped functioning properly in 2007 (before the financial crisis stuck, it was one of the harbingers of doom, actually), and took a very long time to start again, so offshore wind deals have mostly been negotiated as “club deals” – transactions where no underwriting or syndication takes place, and the transaction must be negotiated with all the lenders that eventually contribute funding to the project. This has meant more complex negotiations with large banking groups, and occasionally the risk that individual lenders would hijack the process to ask for better terms for the financing, because they were all indispensable to its successful conclusion.
The table below shows how these different terms have evolved over time in the sector (based on actual transaction closed):
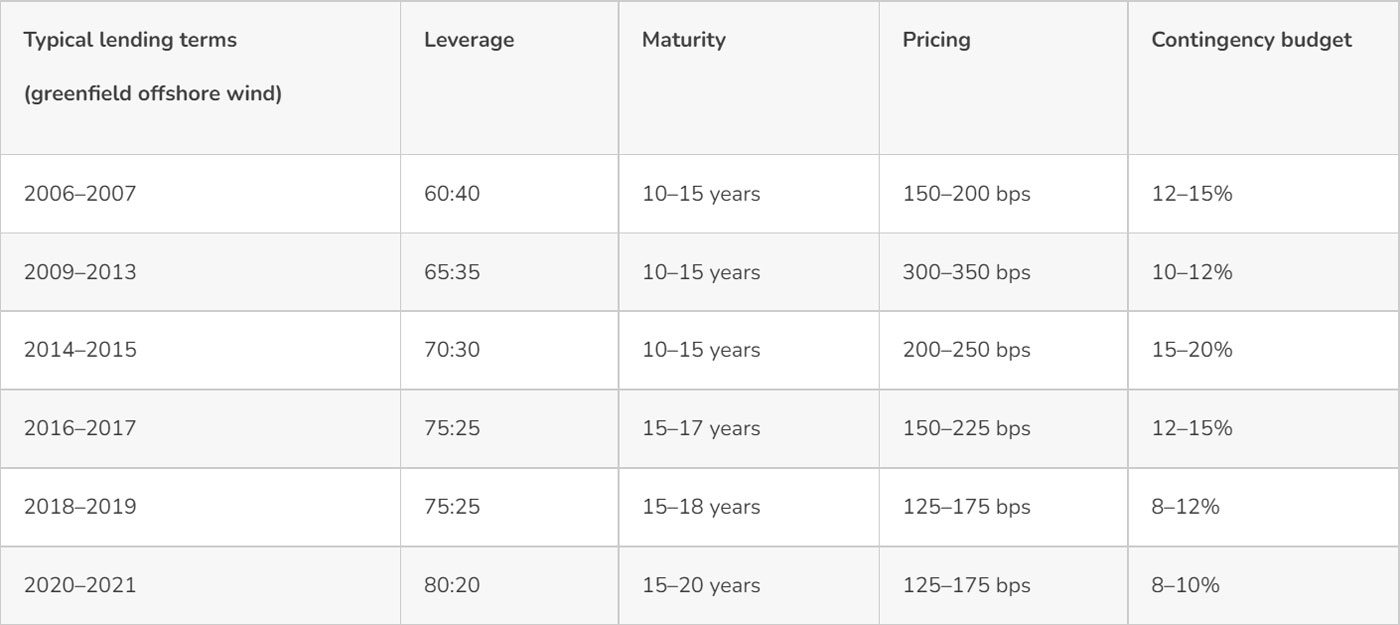
Table xx – refinancing debt terms
Source: Offshore wind debt 15 years on, Jérôme Guillet, PFI Yearbook 2022
As the tables show, the trend is one of long term improvement in terms for borrowers over the years, apart from the immediate period after the financial crisis, when things tightened a bit (mostly on pricing and available funding) but the market never closed: after a crisis, banks tend to focus on key clients, core countries and selective sectors, and offshore wind, which developed in Northern Europe, ticked all the boxes – projects were in highly rated, stable countries, the investors (clients) are experienced IPPs or infrastructure funds that banks favour, and the sector is at the heart of the transition towards clean energy and thus viewed as something that the banks “should do”.
As the track record built up and was very positive, banks became more comfortable with the risks and slowly offered more competitive terms. It is important to note that, like equity investors, nothing stupid has been done by lenders: terms have slowly improved, but without any drop in standards. The sector is like a high plateau – transaction that do not meet the standards (in terms of contractual structure, due diligence, economics) simply do not happen, but if you reach the requisite level of quality, then liquidity becomes plentiful and banks compete on commercial terms like pricing or, increasingly, underwriting.
Structures and lenders
The market was built around a few sectorial pioneers (Dexia, Rabobank) and experienced project finance lenders (see table below), and slowly attracted a wider universe of banks that have less experience but are willing to follow the lead of the core banks. In that sense the sector has followed the traditional route of growing maturity that new sectors typically do – a relevant comparison is to the LNG sector, which followed a very similar path 10–15 years earlier
Insert – banks active in offshore wind
Banks with experience and active in the market
BTMU, BNPP, Rabobank, KfW-IPEX, Natixis, Deutsche Bank, SMBC, SocGen, Goldman Sachs
Santander, Commerzbank, SEB, ABN-Amro, Crédit Agricole, Helaba
Banks with a bit less experience but involved in recent deals or having expressed appetite
Caixa, NIBC, ASN, Mizuho, ING, BNG
Lloyds, Barclays, RBS, Bank of Ireland, RBC, HSBC, NAB (UK focus)
Bayern LB, DZ Bank, Deka Bank, HSH, NordLB, Unicredit (German focus)
DnB Nor, KBC, Investec, Sabadell, BBVA
Canadian banks (with the relevant angle)
Following banks, institutional investors and debt funds have also joined the market and have either joined directly bank transactions, or have participated to specifically designed transactions. Debt funds tend to have slightly different lending capabilities than traditional banks, with a preference for fixed rates, and ability to do longer maturity but less flexibility on the timing of drawdowns. In practice this has meant that institutional tranches have been focused mostly on refinancings post–construction where they provide an additional pool of liquidity. In terms of structures and risk assessment, they are quite close to banks (and their teams are often built up from traditional project finance bankers with similar backgrounds and expertise to those in banking teams).
A handful of transactions have been structured as capital market bonds, which can more easily be traded and get ratings from the leading rating agencies. These target a different universe of funders but in practice, the terms have not been materially different from those provided by commercial banks, and they tend to focus on post–construction refinancings (or financings with completion guarantees): there have not been capital market bond transactions with full construction risk to date, as bond tranches tend to be “fire and forget” (funding is provided and then lenders get out of the way), whereas the construction period usually requires active involvement from lenders to deal with the inevitable unexpected turn of events during that period (which can range from incidents that delay construction to the reverse, such as when unusual weather conditions lead the project developer to accelerate construction to take advantage of that fact, for instance by mobilizing more vessels, thereby spending the budget on a different schedule, something which typically requires a nod from the lenders).
We now see transactions that have parallel bond and debt tranches, on identical terms, in order to tap multiple pools of funders – this has been the case for the large financings such as that for Hornsea 2.
Ultimately, we see two essential categories of debt transactions: those with construction risk, and refinancings of projects post construction that do not bear construction risk. The terms of the first category were presented above, those for refinancings have the following characteristics:
- More aggressive debt sizing, based on a lower cover ratio (typically 1.15) and improved assumptions for a number of project parameters (taking advantage of the fact that real data is available for the project once it is actually operating – for production levels, technical losses, ongoing insurance premia, etc.), usually with no leverage requirement;
- Better pricing, given that the construction risk is gone;
- Less intrusive commitments with respect to project ownership, the right to modify ongoing contracts, etc.
These refinancings often allow the investors to receive special dividends as the amount of debt is increased from the original construction financing, or in replacement of equity altogether in the case of balance sheet– funded projects.
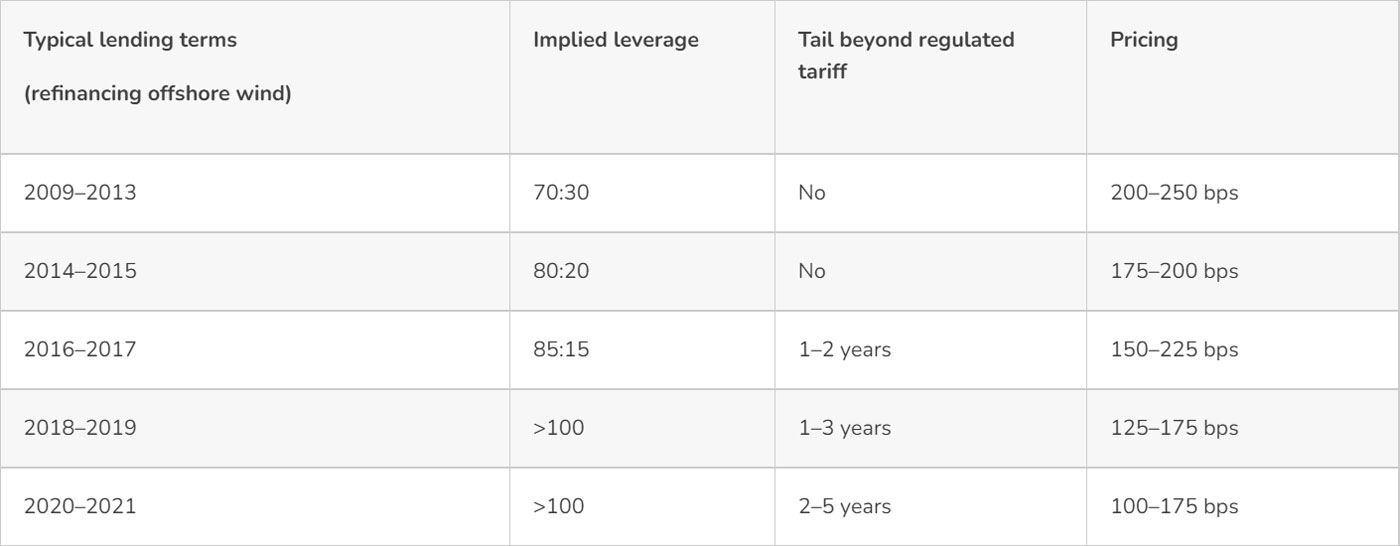
Table xx – refinancing debt terms
Source: Offshore wind debt 15 years on, PFI Yearbook 2022
Altogether, there is a full suite of financing tools available to projects at every stage of their life, providing cheap funding for the development, construction, operation of offshore wind farms, on predictable and competitive terms, and allowing to optimise the cost of electricity. The availability funds is not, and has actually never been, an obstacle to the development of the sector.
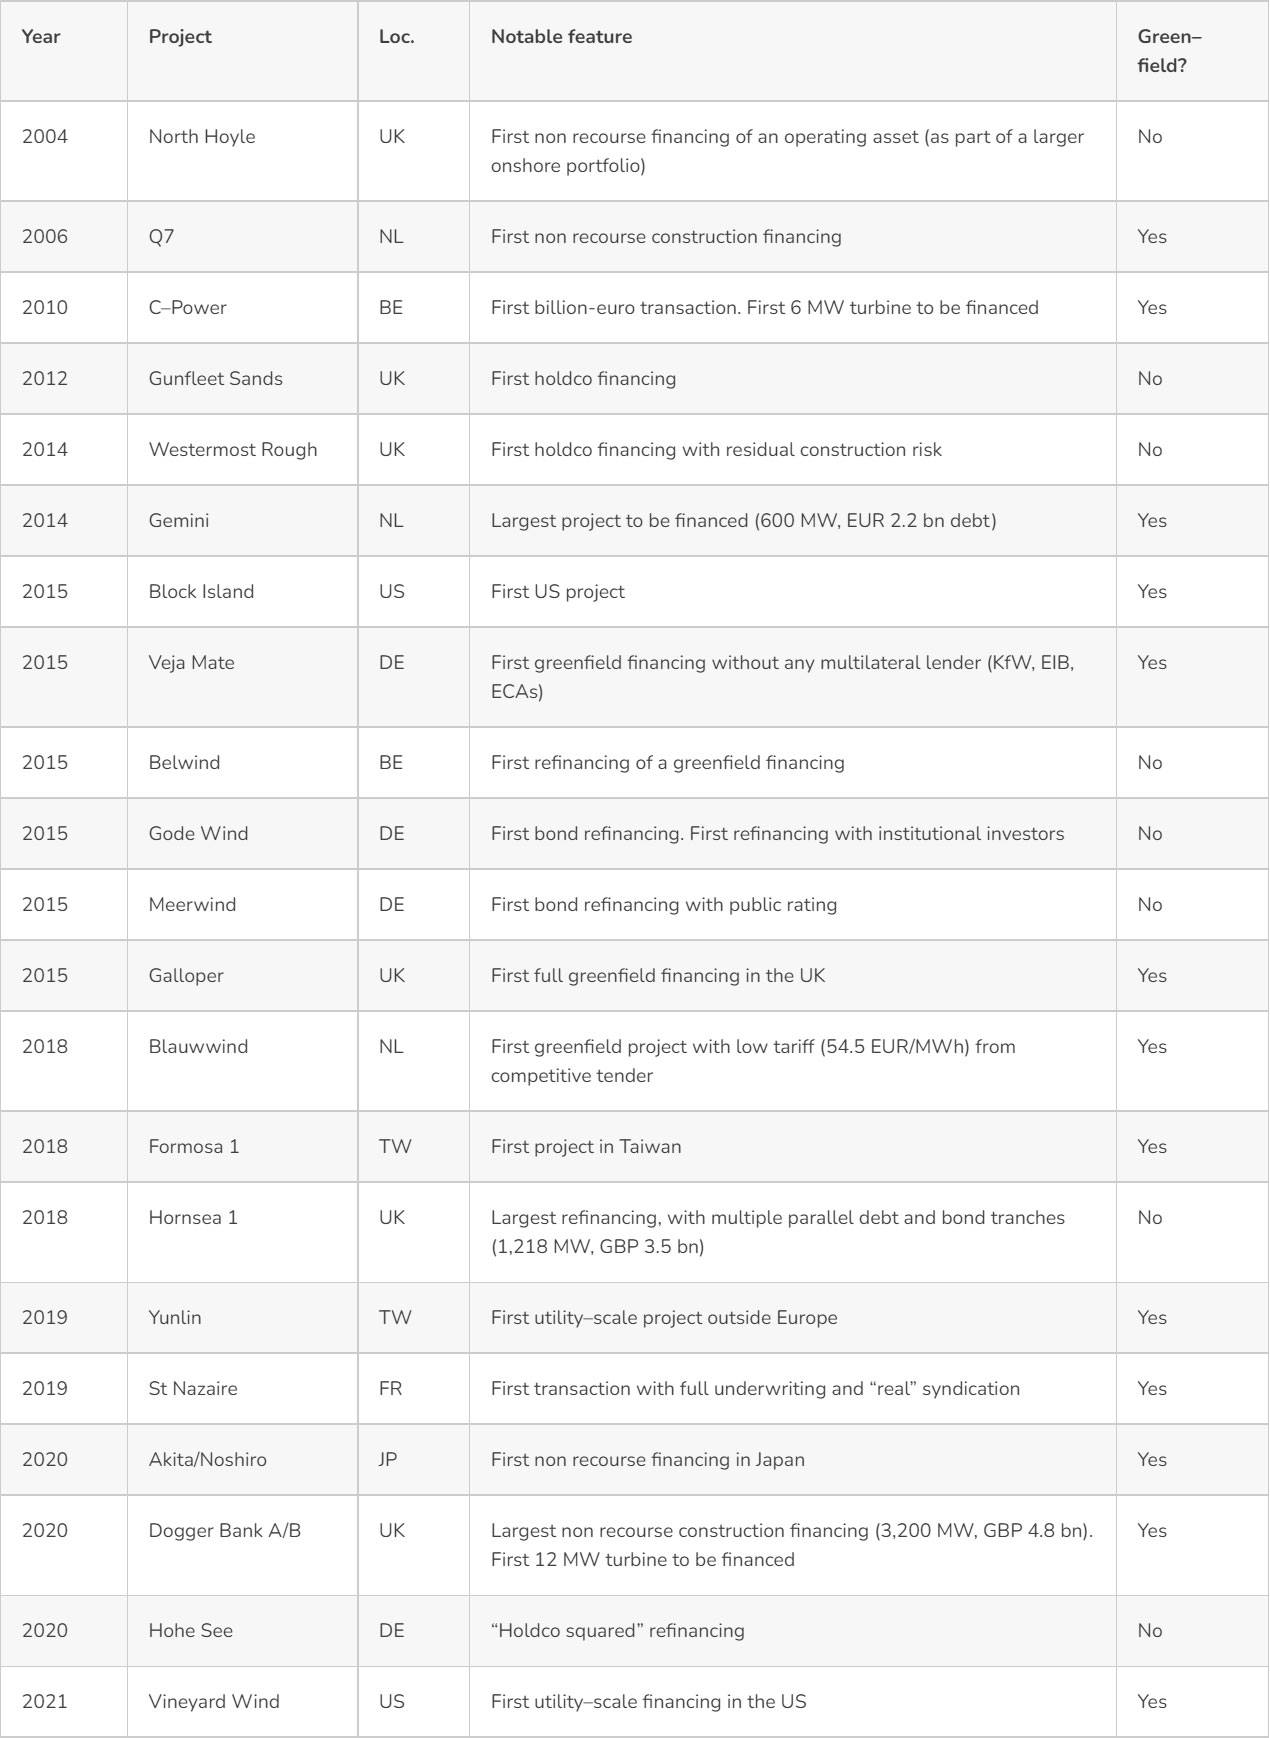
A few notable transactions
In the final part, we’ll look at how the lessons from financing offshore wind can be applied to the nascent floating wind sector.